
Aquant, has recently published the 2022 Service Intelligence Benchmark Report, now available at Field Service News, which offers an in-depth analysis of field service performance and customer satisfaction in a year of talent shortage, COVID service pivots, and shifting customer demands. In this final excerpt from the report, we discuss how companies can look beyond KPIs.
The Customer Experience Gap
The Customer Experience Gap shows the difference between what customers expect and what your organization delivers.
Our analysis shows that companies who measure FTF rates in 7-day or 14-day windows are setting the stage for a wide experience gap—which leads to frustrating customer experiences. The moral of the story: a few metrics can’t provide the entire picture. It’s time to look at the experience as a whole.
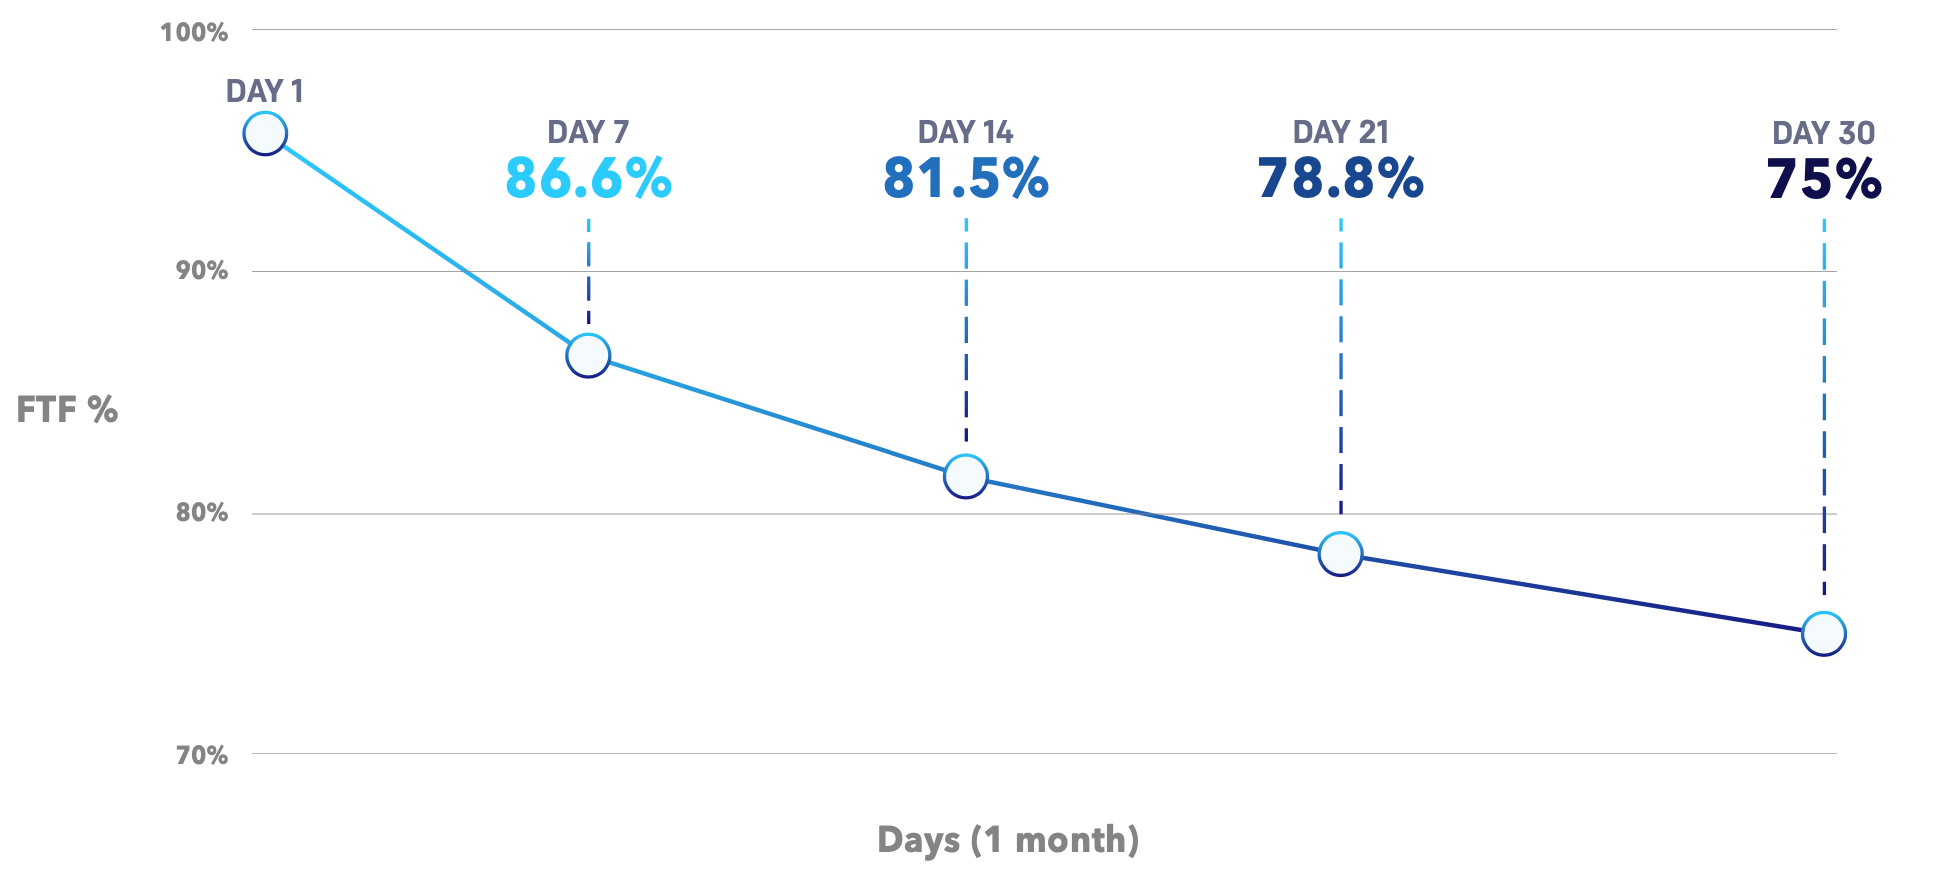
Instead of defining FTF in arbitrary time increments (7 days, 14 days, or 21 days), think about it in terms of the natural service cycle. Our research shows that measuring in 30-day windows strips out false-positive FTF rates.
Understand where your organization falls on the Customer Experience Gap chart.
- If your FTF rate is similar when measured at 7 days and 30 days, you have a small gap.
- If your FTF rate has a wide variation (usually a high rate at 7 days and a low rate at 30 days), you have a large gap.
- If you have a large gap, your team is focused on hitting their numbers instead of focusing on great customer experiences.
Why FTF Rates Vary by Time
When measured in short windows (like 7-day increments), jobs where a technician made an incorrect fix—but got the machine to work temporarily—will be marked as complete.
But an incorrect fix is only a temporary measure, and the machine will continue to break down until properly repaired. For instance, a customer may call for service two or three times in a 30-day window. If you only measure in 7-day increments, your dashboard may show you successfully completed three jobs for one customer. In reality, these were three failed visits.
This environment also leads to customer escalations and customer complaints that management may deem as “surprise complaints” that they didn’t see coming.
Two Examples of Poor Customer Experiences
Company A: KPIs are not aligned to customer outcomes
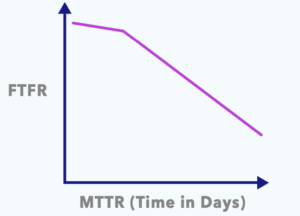
When FTF curves start out flat, it means that the company likely incentivizes high FTF rates over deep problem-solving. That’s shown by the curve getting steeper at the end of a 30-day cycle, indicating that the FTF rate is plummeting.
The key takeaway: Company A is not closely monitoring FTF rate—or there is no incentive to maintain a high rate over a long period of time—leading to poor customer experiences.
Company B: KPIs are not aligned to customer outcomes
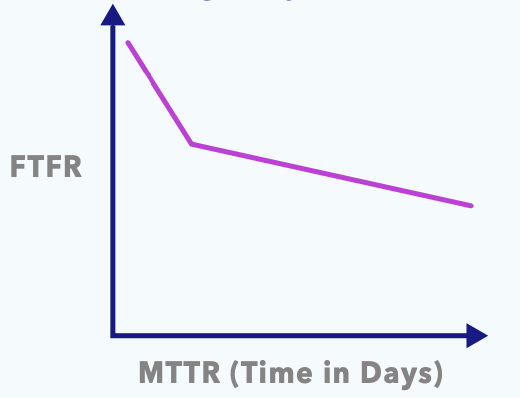 Here, the FTF rate starts out high and eventually flattens out. This may indicate that more preparation, information, or triage was needed before visiting a job site. A return visit would most likely be required to successfully solve the problem. Unlike Company A, Company B eventually solves root problems, but it requires several visits.
The key takeaway: Company B is trying to provide great customer service, but has some limitations that hinder quick and accurate outcomes, such as a lack of prep or an employee knowledge gap.
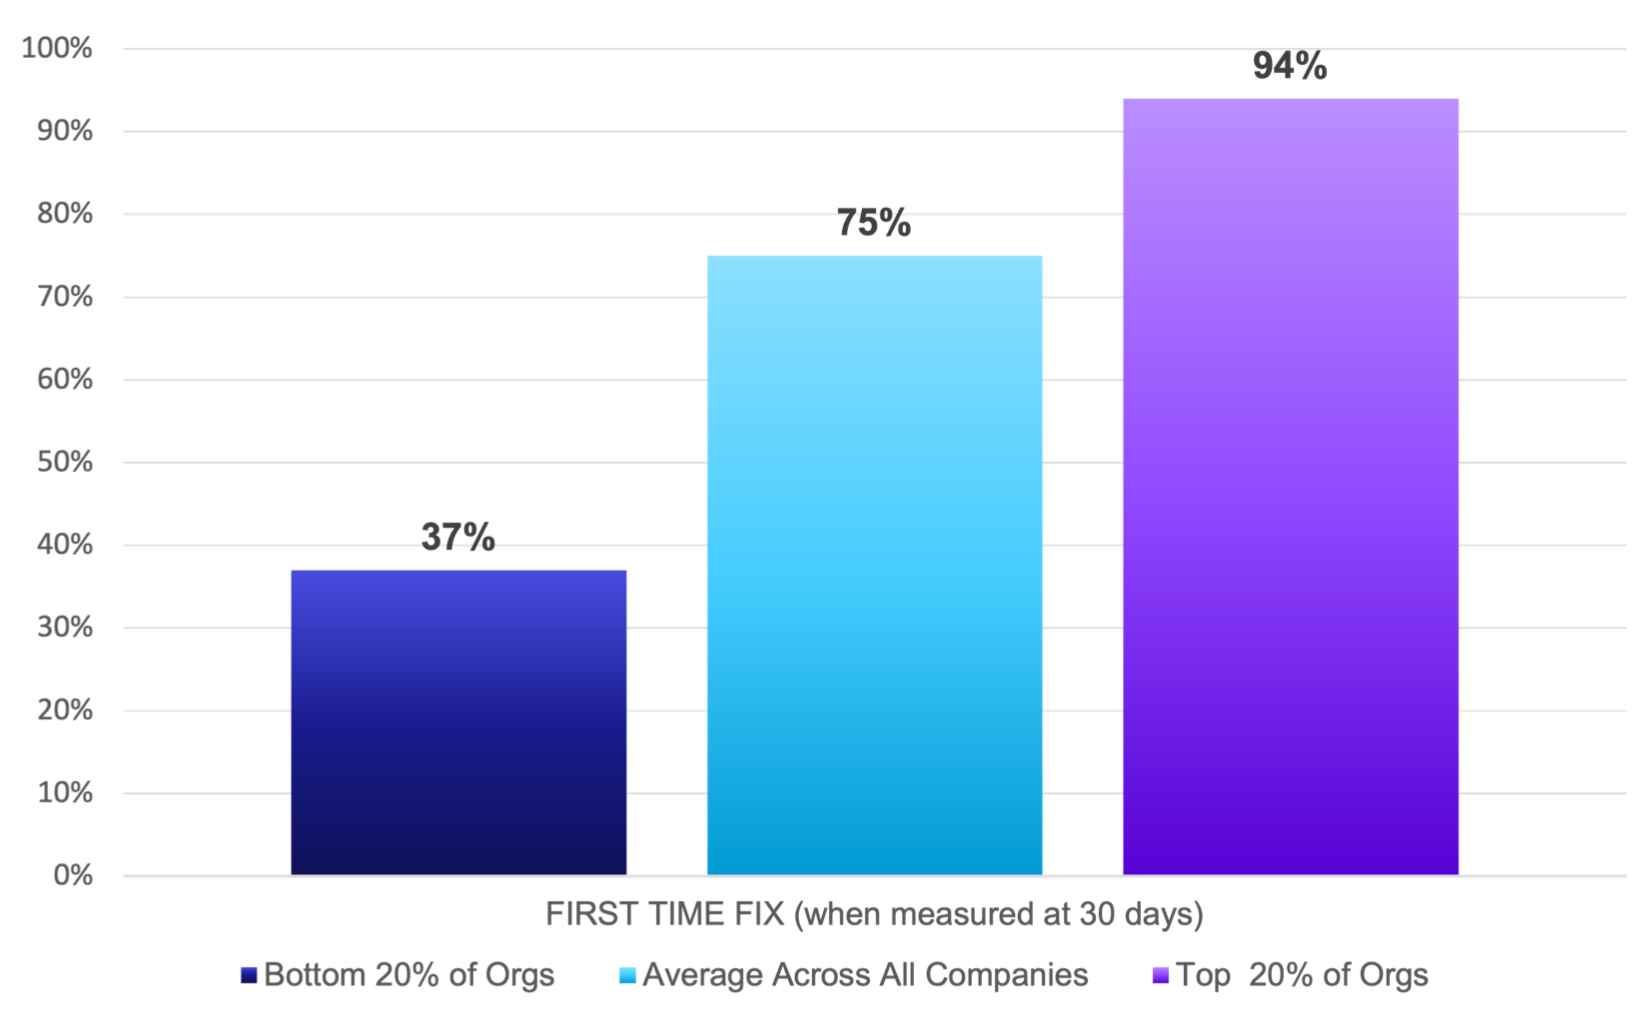
The Skills Gap – A Profile of the Top and Lowest Performing Organisations
What does the knowledge gap have to do with hitting KPIs? If there is a large knowledge gap between team members, performance will vary—and so will customers’ experiences. That’s why it’s crucial to make sure that your technicians are equally knowledgeable about the equipment that they service and up-to-date on specific customer preferences.
So how can you determine your team’s skills gap? To increase your team’s knowledge and success, you must first identify how much of a gap exists between your star technicians (heroes) and underperformers (challengers).
For this report, we calculated the percentage difference between heroes and challengers across all organizations on the following page. We divided it into:
- Above-average organizations
- Above performing organizations
- Below average organizations
A Snapshot of high performing and low performing organizations
The top 20% of organizations have a smaller workforce skills gap. A workforce with a more equal knowledge distribution results in more consistent customer experiences.
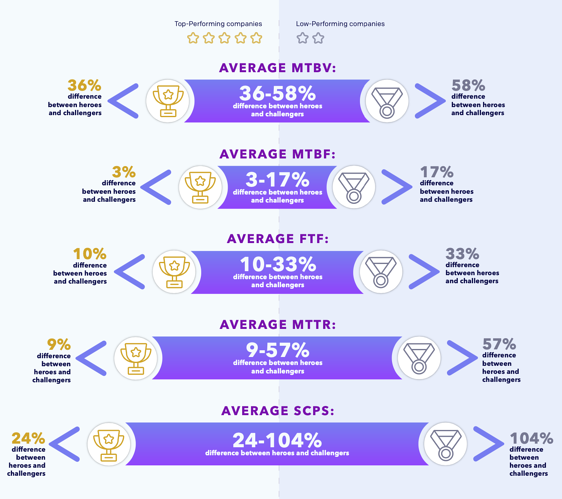
Why the Skills Gap Matters
A bigger distance between heroes and challengers leads to:
- Decrease in customer satisfaction
- Increased workload on your already overburned experts
- Increase in service costs
- Less capacity for organizational resilience
- Negative impact on growth
What’s Next?
The service industry is facing unprecedented workforce shortages and increasing customer demands. A better way to overcome these challenges is to understand your business on a much deeper level than you do today so you can tailor service for every customer.
![]() Data usage note: By accessing this content you consent to the contact details submitted when you registered as a subscriber to fieldservicenews.com to be shared with the listed sponsor of this premium content Aquant who may contact you for legitimate business reasons to discuss the content of this white paper.
Data usage note: By accessing this content you consent to the contact details submitted when you registered as a subscriber to fieldservicenews.com to be shared with the listed sponsor of this premium content Aquant who may contact you for legitimate business reasons to discuss the content of this white paper.

Turning knowledge into action for the manufacturing industry.